Comparable flight activity
Reported passengers, seats and departures on the eight selected routes during the study period.
PERSONAL PROJECT / AVIATION ROUTE ANALYSIS
A personal feasibility study using comparable routes in BTS T-100 data.
SEA / MTY
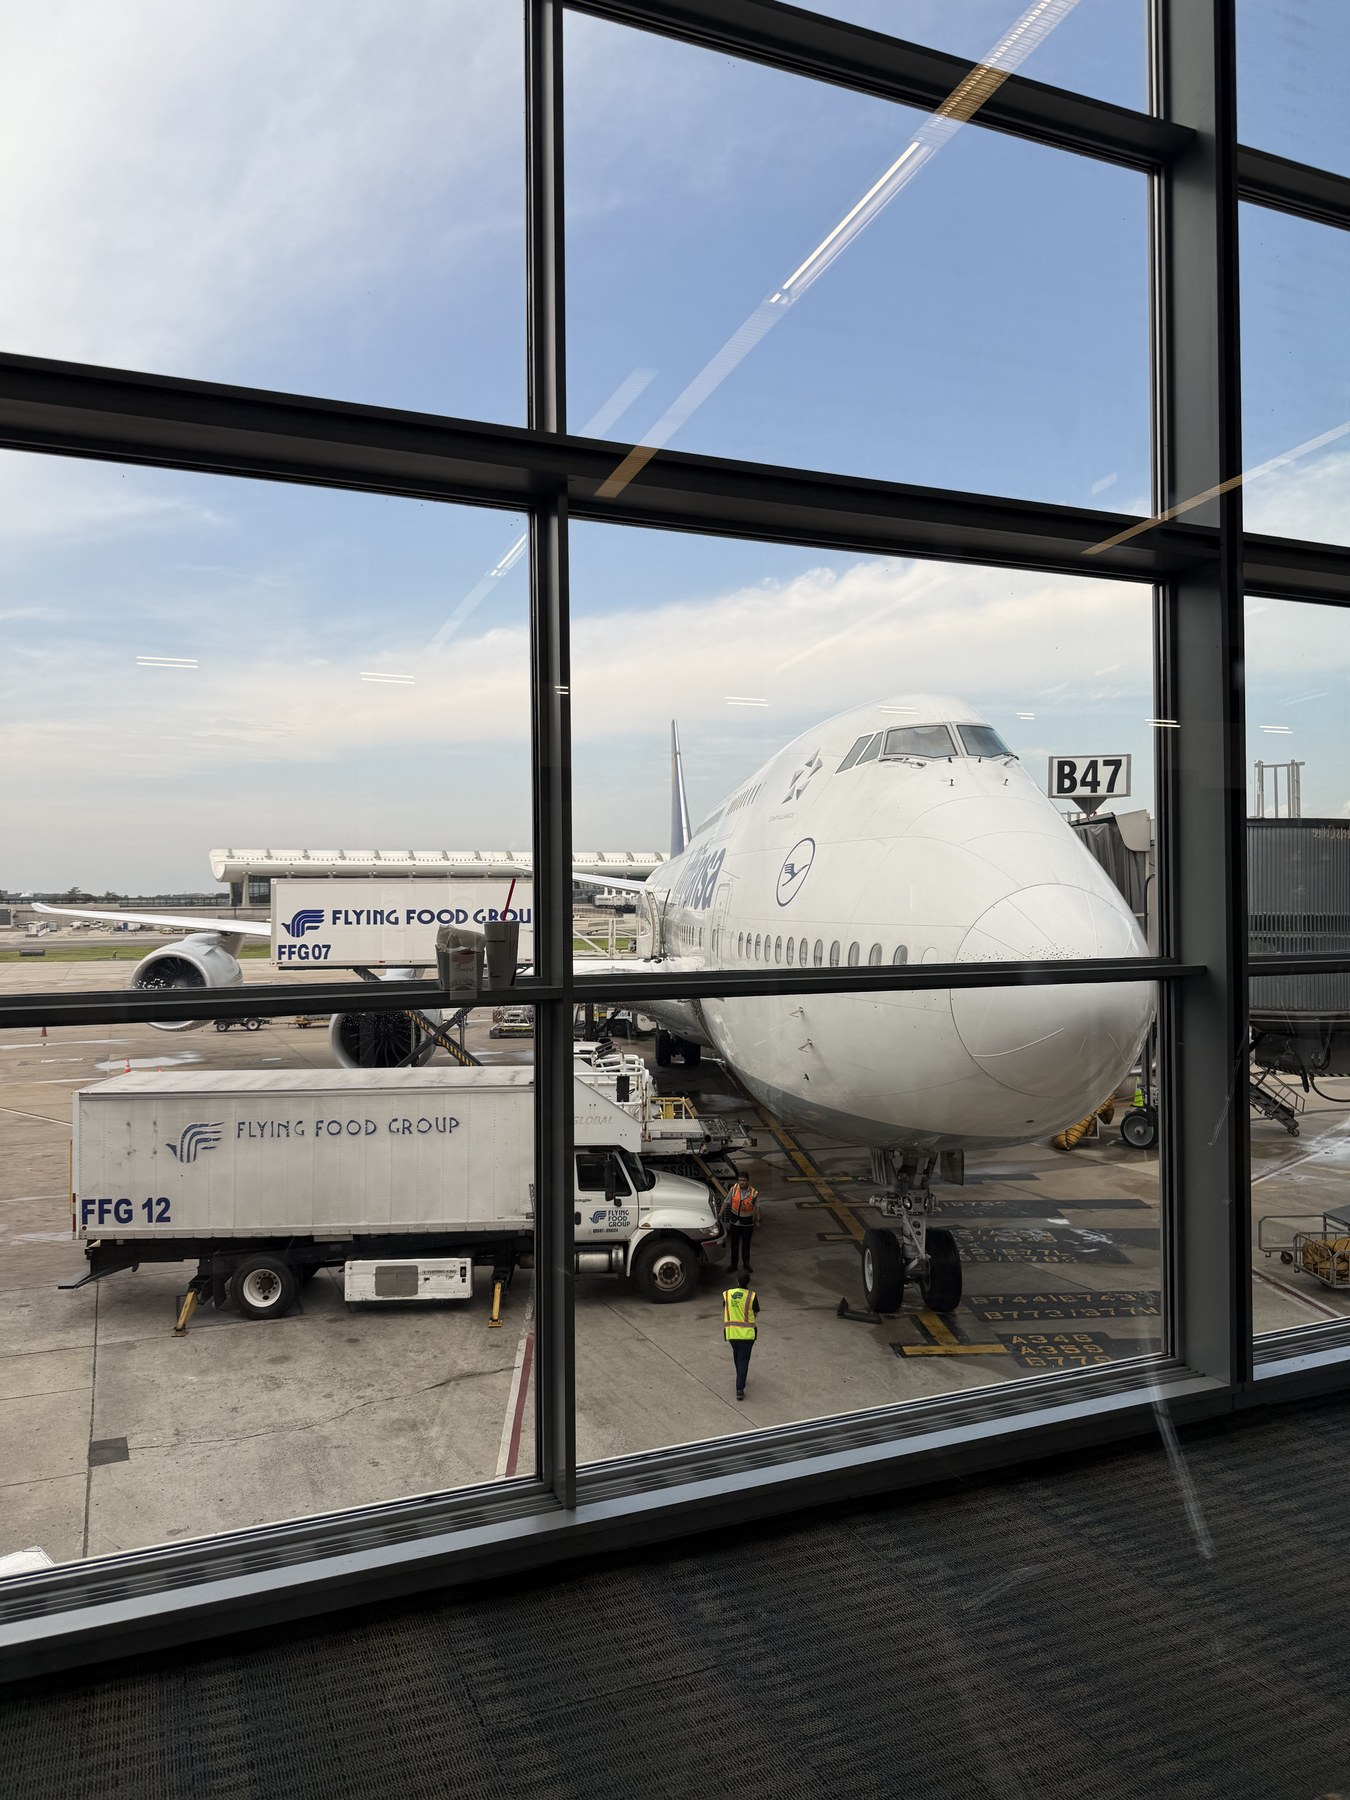
My interest in aviation led me to a specific question: what would make a nonstop Seattle to Monterrey flight plausible? I used comparable routes to explore the traffic and capacity patterns a new service would have to work within.
This study analyzes selected routes in T-100 International Segment data from 2023 to 2025. It does not establish whether SEA to MTY has ever had nonstop service, and it does not measure the full market of passengers traveling between the two cities via connections.
METHOD
SEA-MEX and SEA-GDL represent the Seattle side. MTY-PHX, MTY-DEN, MTY-SFO, MTY-DTW, MTY-LAX and MTY-OAK represent the Monterrey side.
Each comparable route is analyzed across the available 2023 to 2025 data for passenger volume, seat capacity, load factor, seasonality and carrier concentration. The two sides are then blended into an implied range for SEA to MTY.
Coverage: January 2023 through the most recent available month of 2025.
READING THE EVIDENCE
Reported passengers, seats and departures on the eight selected routes during the study period.
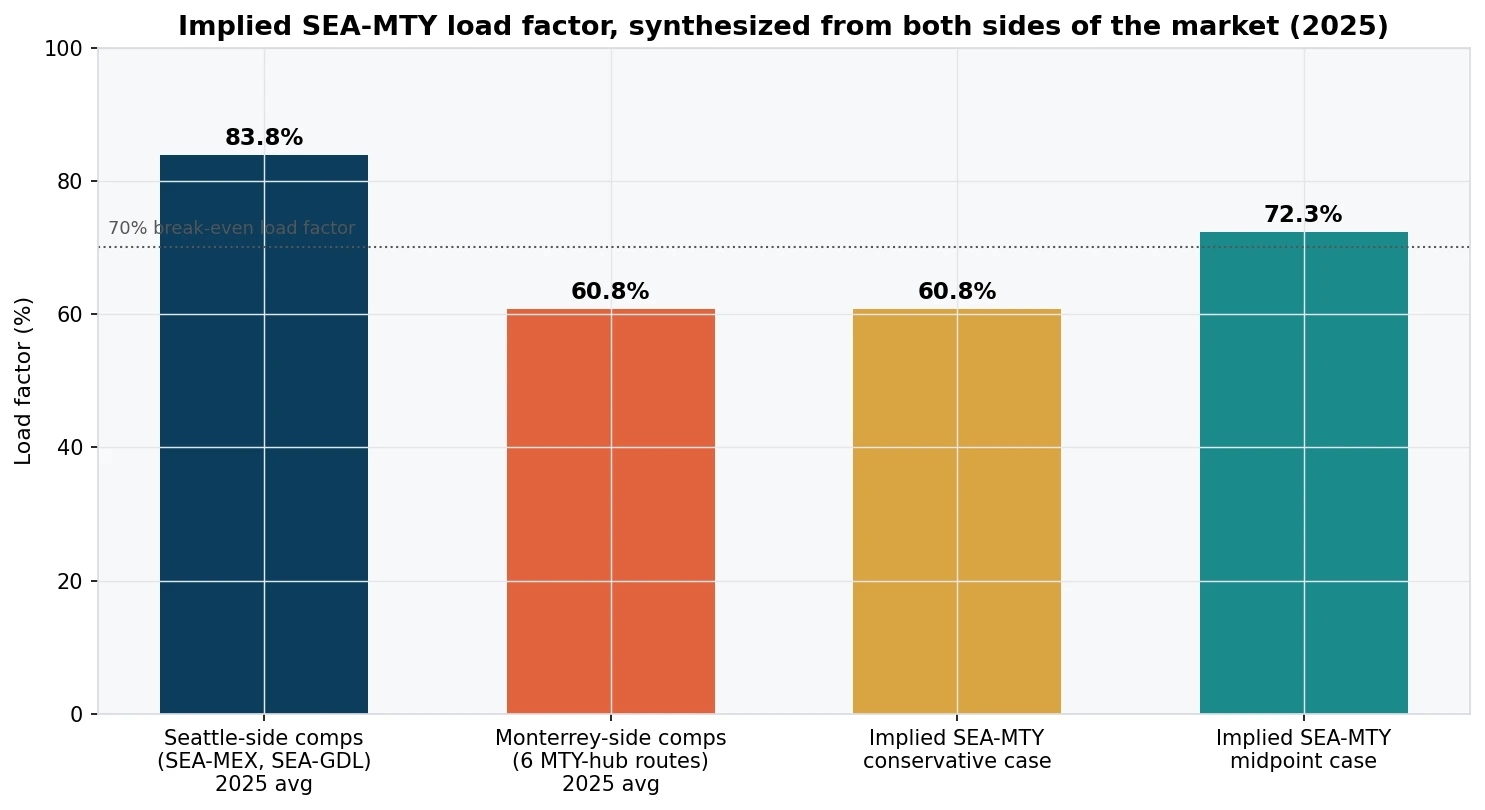
The 61 to 72% load-factor range blends comparable-route performance. It is not observed SEA to MTY demand.
An illustrative benchmark in the study, not a modeled break-even load factor for the proposed service.
T-100 describes nonstop segment traffic, which can include connecting passengers. See the US DOT technical notes. Break-even depends on costs and passenger yield; see the BTS explanation.
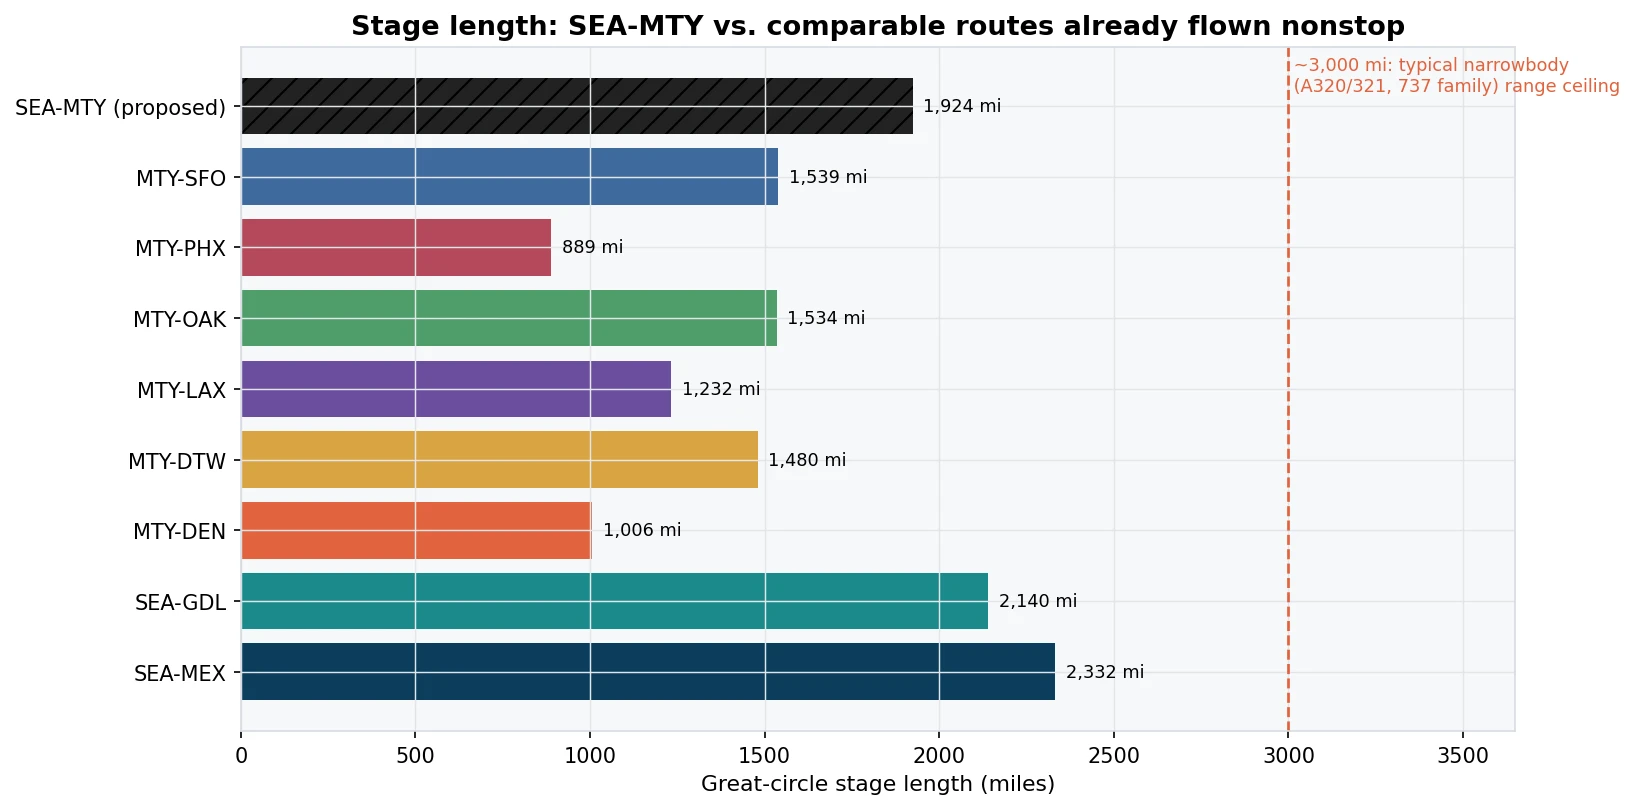
SEA to MTY is a roughly 1,924-mile great-circle route, shorter than both of Seattle’s existing Mexico routes: SEA to GDL at 2,140 miles and SEA to MEX at 2,332 miles. It is comfortably within the range of the A320/321neo and 737 MAX families.
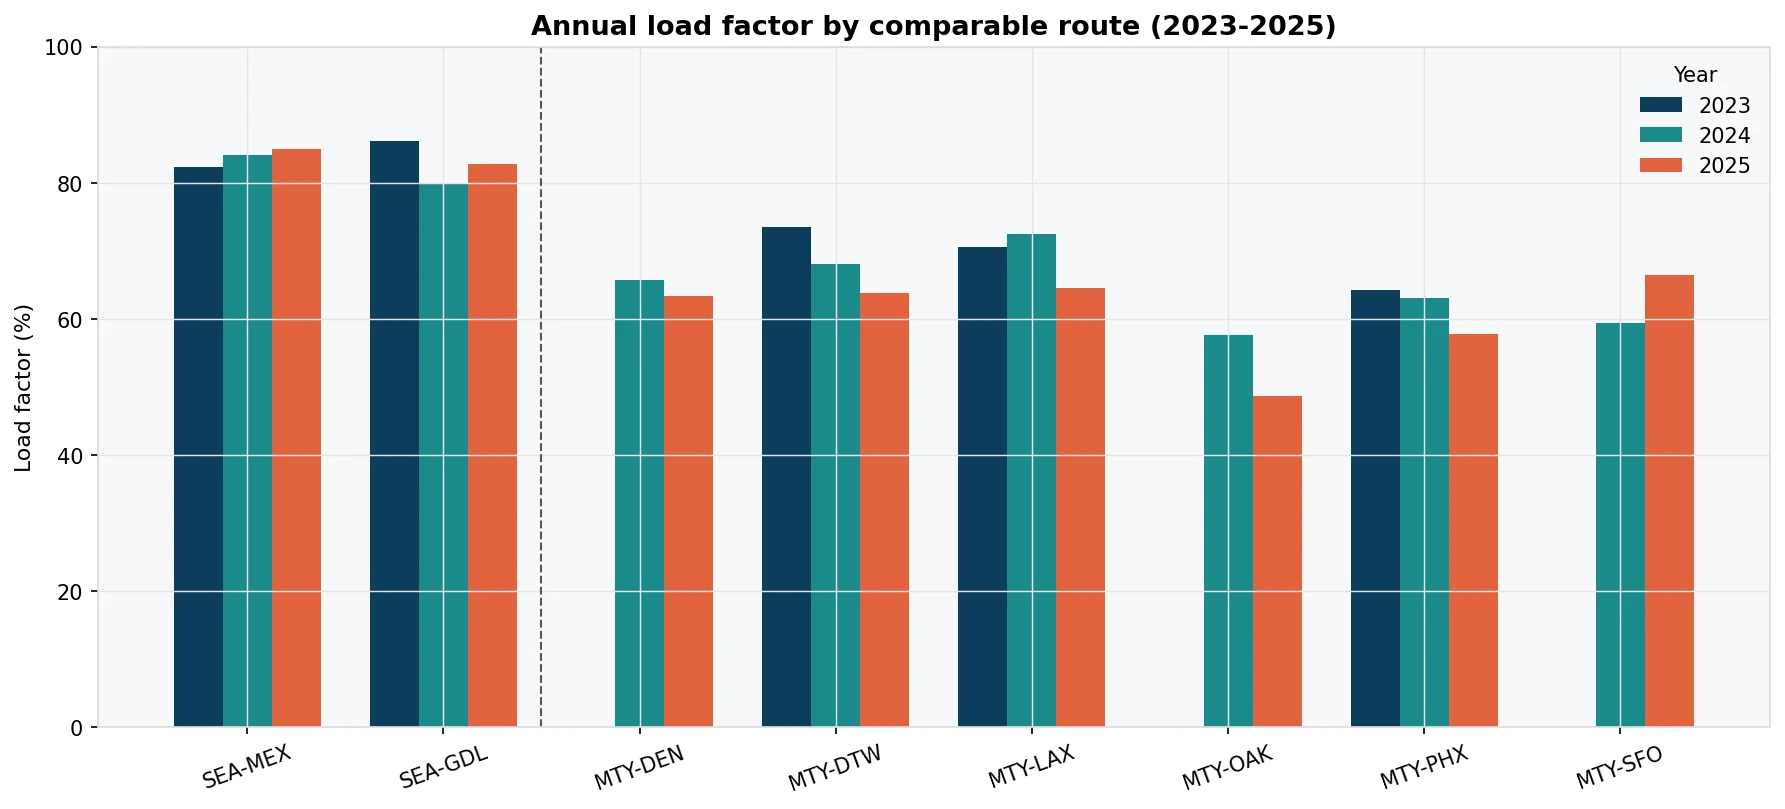
SEA to MEX and SEA to GDL ran annual load factors of 80 to 86% from 2023 to 2025, with passenger volume growing on both routes.
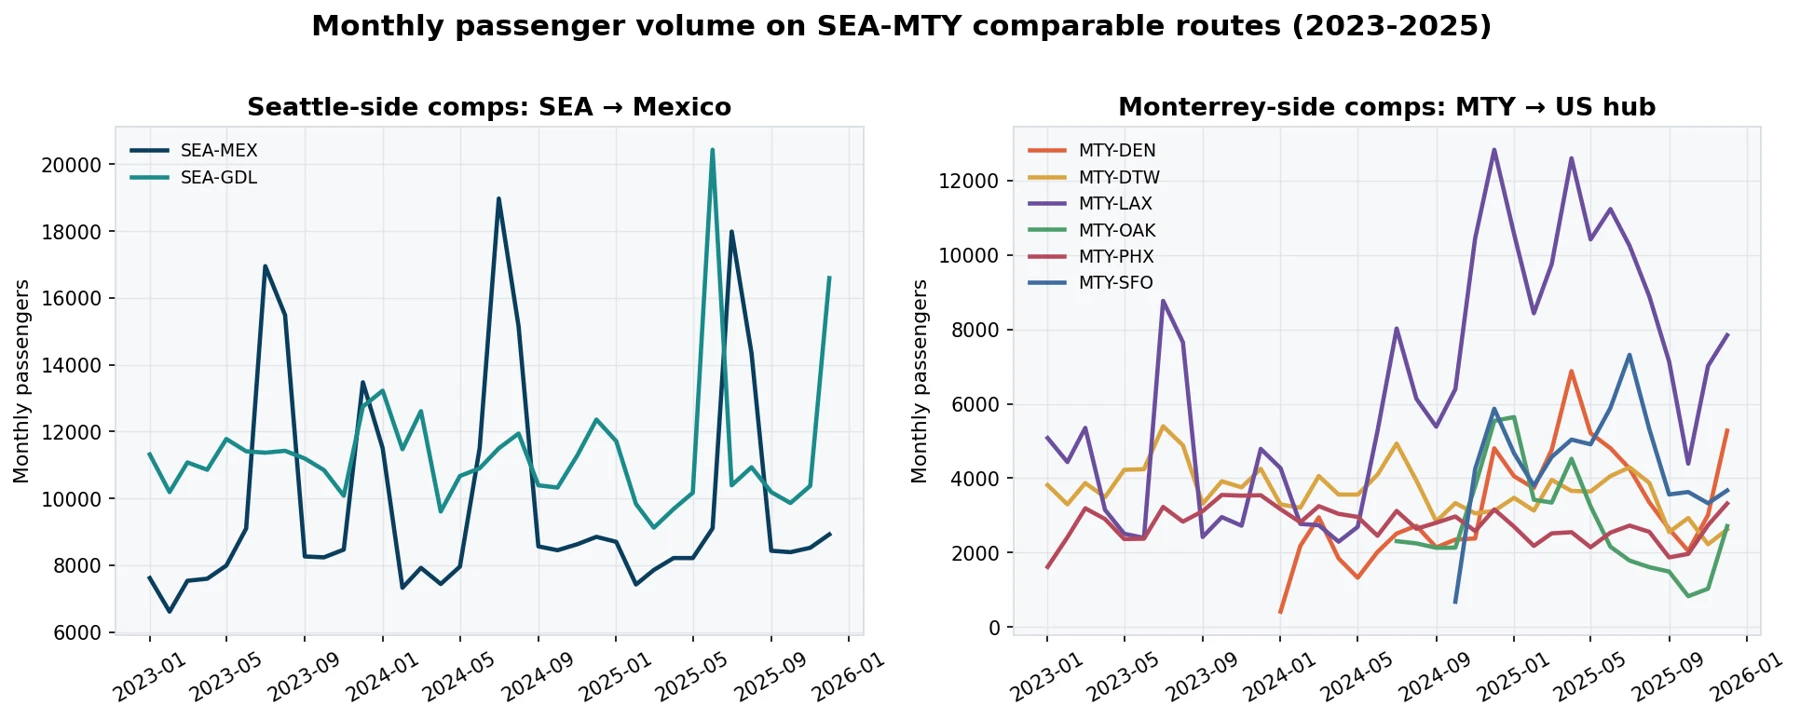
The six Monterrey hub comparisons averaged load factors of 58 to 73% in 2023, trending down to 49 to 66% by 2025 for most routes. Monterrey to LAX and SFO were the exceptions, with both growing.
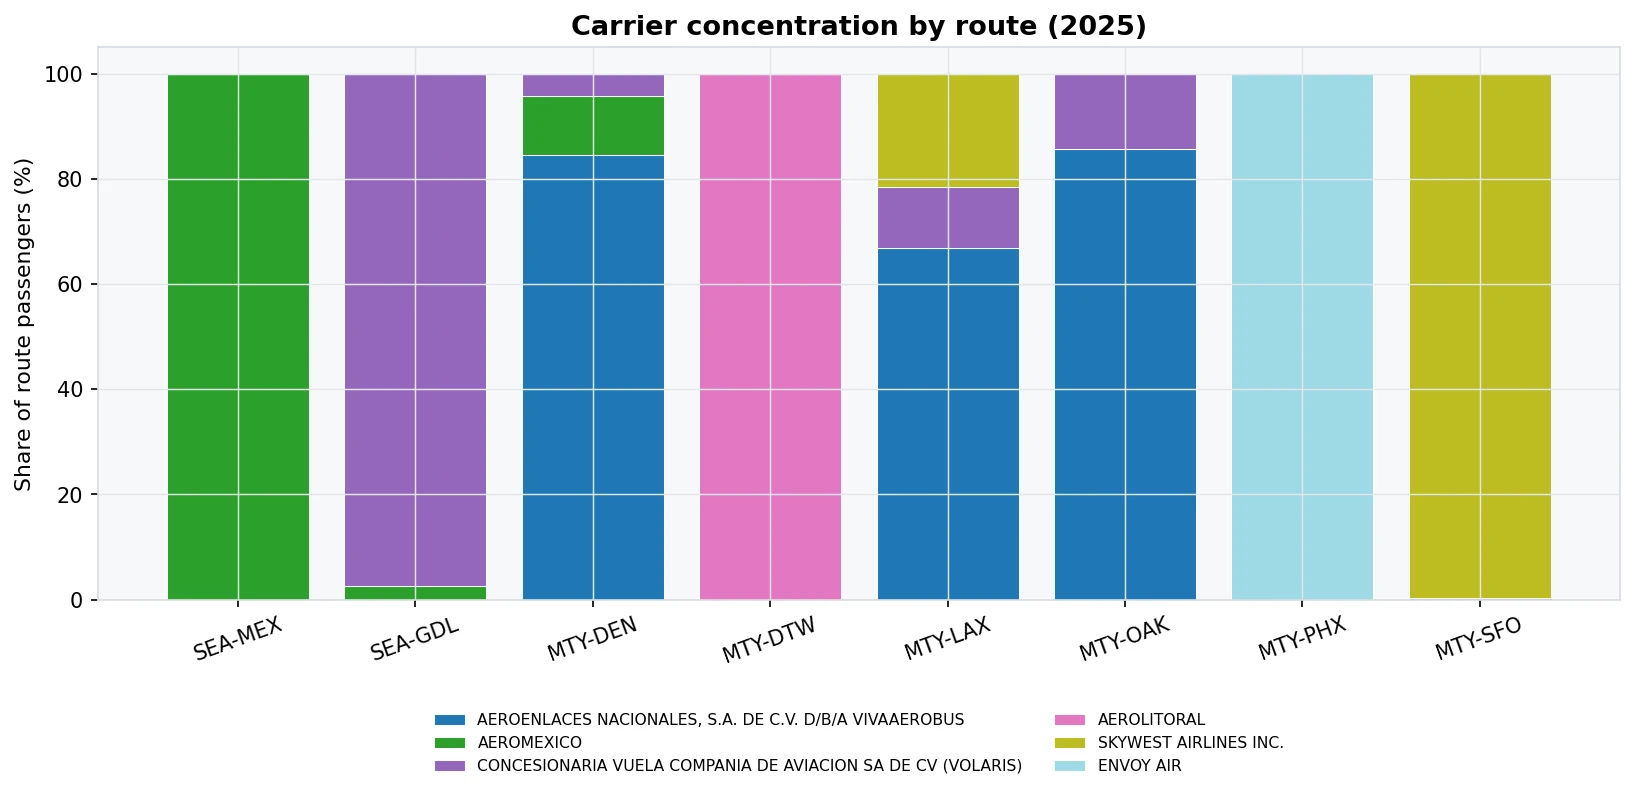
In the study’s 2025 data, Aeromexico carried approximately 100% of SEA to MEX traffic and Volaris approximately 97% of SEA to GDL traffic. This describes the operating carriers on those segments; it does not establish the competitive position of a proposed SEA to MTY service.
Blending the 2025 Seattle-side load factor of 83.8% and Monterrey-side load factor of 60.8% gives an estimated SEA to MTY range of 61 to 72%. Only the upper end exceeds the study’s assumed 70% comparison point. Without a route-specific cost and revenue model, that does not establish profitability.
FROM THE PROJECT README
The comparisons make SEA to MTY worth investigating, but do not establish commercial viability. The scenario range is weaker than the Seattle comparisons alone and sensitive to which routes are treated as comparable.
A launch assessment would need true origin-and-destination flows, connecting itineraries, fares and yield, operating costs, a schedule and an airline network context. Distance and aircraft range are only an initial operational screen.
KNOWN LIMITATIONS
Supply-side only. T-100 reports capacity and traffic actually flown, not underlying demand, fares, or yield (that would require BTS's DB1B fare survey, not included here).
No demographic/economic demand model. A fuller study would incorporate O&D population, GDP, trade volume, and diaspora/VFR (visiting-friends-and-relatives) data for the SEA and MTY catchment areas. This analysis relies solely on how comparable routes have actually performed.
Comparable routes are proxies, not guarantees. No two markets are identical; the six MTY-hub comps and two SEA-Mexico comps were chosen for similarity in stage length and hub role, but a real route-planning decision would weight additional factors (connecting traffic, corporate travel agreements, codeshare partners) not captured here.
REPRODUCIBLE ANALYSIS
The downloads are original study artifacts. Read their benchmark language with the assumptions clarified above: the 70% reference is illustrative, and historical service and total market demand were not established by this comparison.