How do you compare laboratory performance across more than 40 plants fairly?
A year at CEMEX Switzerland connecting laboratory measurements, data validation and follow-up with local teams.
LOCATION
Brugg, Switzerland
PERIOD
February 2025 to February 2026
COMMITMENT
Full time, one year
DISCLOSURE
No company data or internal results are shown.
One year
Full-time industry experience in Switzerland
February 2025 to February 2026
Across sites
Laboratory coordination and reliability analytics
CEMEX Global Operations & Technology
ANALYTICAL RELIABILITY / MY YEAR IN PRACTICE
From a laboratory result to a shared understanding.
My role connected the laboratory, the data, and the people responsible for both. I ran the evaluation cycle from the comparison methodology through reporting and corrective-action follow-up.
Set the basis for a fair comparison
I designed the comparison methodology and organized the evaluation around a fixed calendar. The starting point was a shared basis for interpreting laboratory results across participating sites.
I coordinated sample distribution and results collection. This connected the analytical plan with the practical work of the participating laboratories.
Sample distribution↓Results collection
Make the incoming data usable
I built data quality controls and outlier detection into the review. Before interpreting differences between sites, the incoming information needed to be checked consistently.
Incoming laboratory results↓Validated information for analysis
Turn results into useful views
I developed statistical benchmarking and a Power BI platform for trend analysis across the network. The work connected individual results with a broader view of analytical reliability.
Statistical benchmarking↓Comparable views and trends
Understand the differences
I reviewed deviations with attention to calibration and verification, procedure differences, equipment condition, and sample preparation. A difference in a result became a question to investigate with the site.
A deviation worth reviewing↓Possible causes discussed with local teams
Connect the analysis to action
I agreed corrective actions with local laboratory and plant managers and followed them through to closure. Technical reports, harmonized methods, and work instructions carried the findings back into practice.
Agreed corrective actions↓Follow-up, reporting, and consistent methods
Generalized overview of my responsibilities. No plant-level data, internal thresholds, or company results are presented.
PROGRAM COORDINATION
What I ran
I ran an analytical reliability evaluation program across more than 40 plants: designed the comparison methodology, coordinated sample distribution and results collection on a fixed calendar, validated incoming data and reported back to participating sites.
DATA QUALITY AND REPORTING
A Power BI platform for more than 60 plants
Built the data quality controls, outlier detection and statistical benchmarking that made comparisons between plants defensible enough to support operational decisions.
Designed and delivered a Power BI platform for a multi-site plant network, used for trend analysis and transfer of better practice across the network.
The reliability program and dashboard had different scopes: 40+ participating plants in the evaluation program, and 60+ plants covered by the reporting platform. The dashboard supported trend review and comparison; those counts are not impact measures.
A CONCRETE CHALLENGE / GLOBAL COLLABORATION
Making a shared dashboard useful to the people running the plants.
01 / THE CHALLENGE
Reports needed a common home
I organized quality-report figures from plants across the CEMEX network into a workable Power BI tool. Its purpose was to help teams compare performance, notice where support was needed and learn from one another’s practices.
02 / MY RESPONSE
The tool and the conversations
With my team, I met directly with plant heads across global operations to explain the tool and discuss its value. We followed up through extensive email exchanges, tutorial examples and practical guidance.
03 / WHAT I LEARNED
Building it was only part of the work
The conversations helped communicate why the platform mattered. My takeaway was that technical delivery and user adoption belong together: people need to see how a shared tool supports the decisions they already make.
An anonymized account of the work and communication process. No company figures, screenshots or measured adoption outcomes are disclosed.
FOLLOW-THROUGH
How I worked with sites
Investigated why sites deviated from expectation, covering calibration and verification gaps, procedure variance, equipment condition and sample preparation, and agreed corrective actions with local laboratory and plant managers, following them through to closure.
Authored technical reports and harmonized methods and work instructions across the network, presenting to technical and senior audiences in an international organization.
THE WORK BEHIND THE REPORTING
Laboratory practice, analysis, and coordination.
Understand the measurement
Practical laboratory training gave me context for the results I was comparing: how a sample is prepared, what an instrument measures, and where differences can enter the process.
Build the analytical view
Power Query and advanced Excel supported data preparation. Minitab and statistical benchmarking supported comparison. Power BI brought the reporting into a platform for reviewing trends across sites.
Make the work usable
I wrote technical reports, helped harmonize methods and work instructions, and presented findings to technical and senior audiences. Follow-up with local managers connected the analysis to agreed actions.
LABORATORY TRAINING
Laboratory methods used in materials testing.
Practical training across chemical characterization, sample preparation, and physical testing. These methods gave me a closer understanding of the measurements behind analytical reliability.
12 methods
Practical training
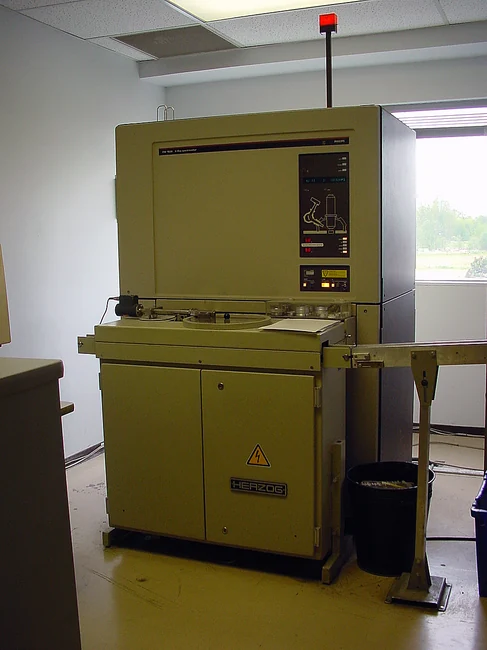
XRF
X-ray fluorescence for elemental composition. A view of which elements are present in a material.
XRF spectrometer · reference photograph
Practical training
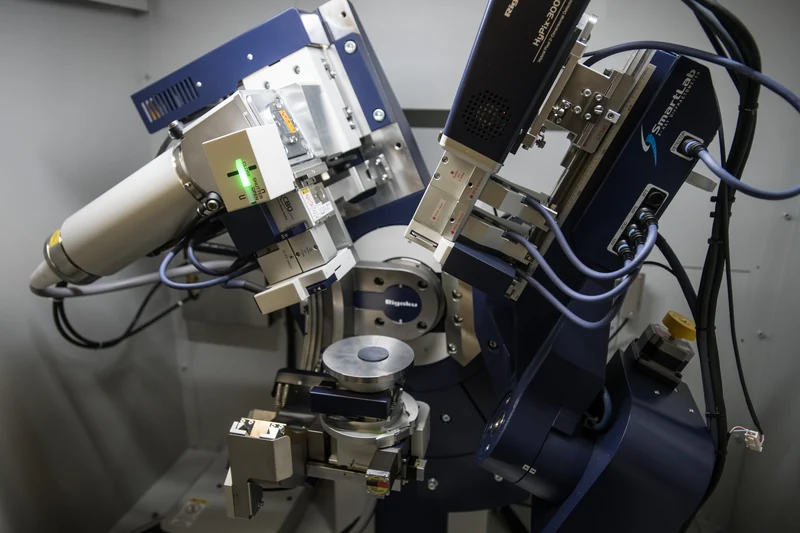
XRD
X-ray diffraction for crystalline phase identification. A complementary view of how the material is structured.
Powder diffractometer · reference photograph
Practical training
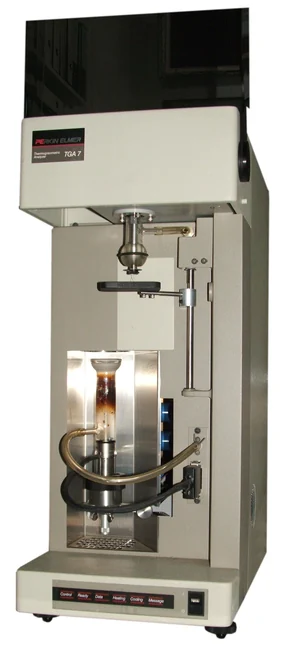
TGA
Thermogravimetric analysis tracks changes in sample mass as temperature changes.
Thermogravimetric analyzer · reference photograph
Practical training
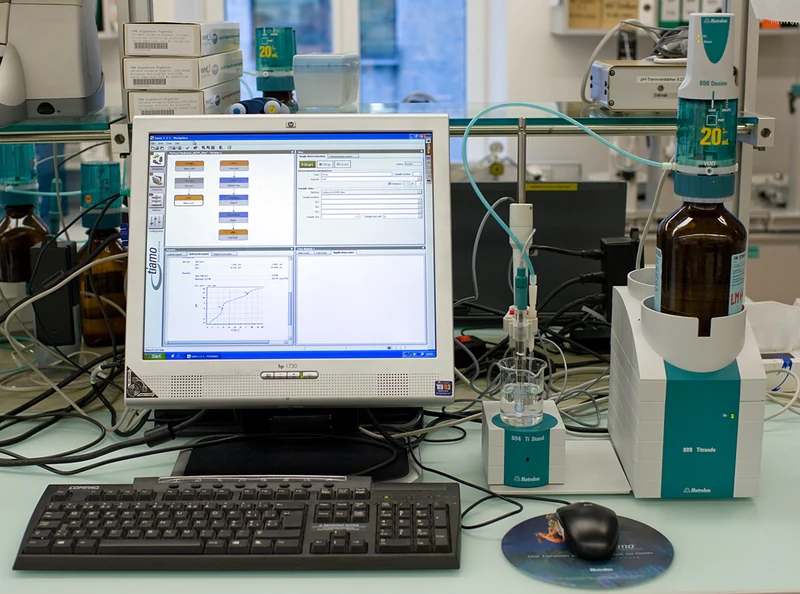
Free lime
Determination of uncombined calcium oxide in cement-related materials.
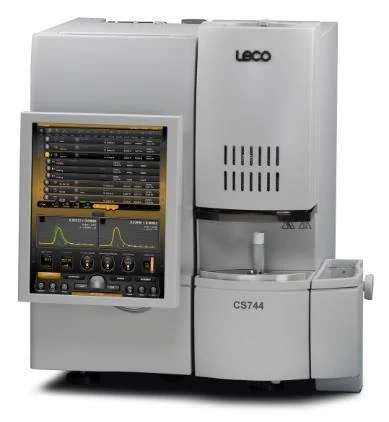
Combustion-based carbon analysis to characterize the carbon content of a sample.
LECO CS744 instrument · reference photograph
Practical training
Sieving
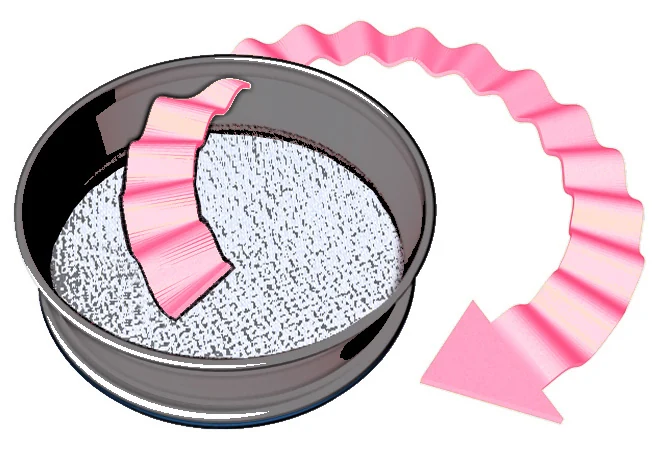
Separating particle-size fractions with test sieves to characterize a granular sample.
Laboratory sieve shaker · reference photograph
Practical training
Grinding
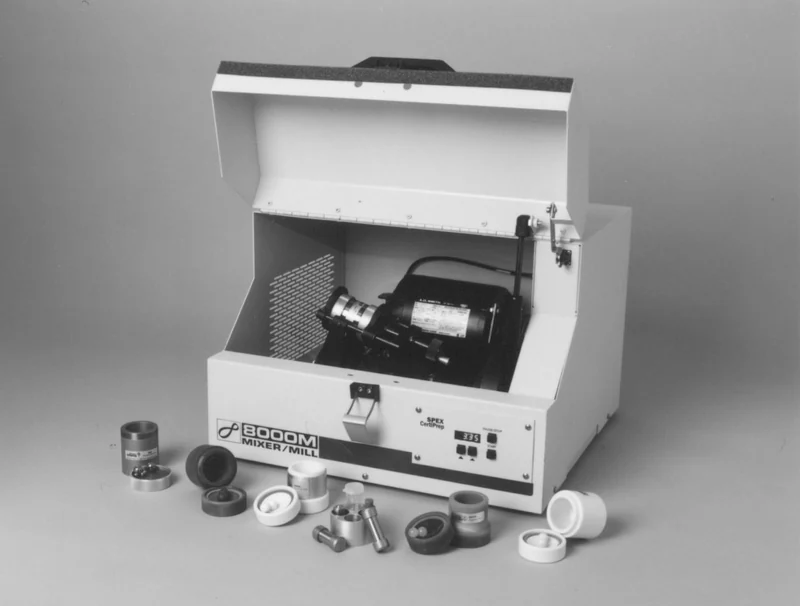
Reducing particle size and preparing a more homogeneous sample for subsequent analysis.
Laboratory mixer mill · reference photograph
Practical training
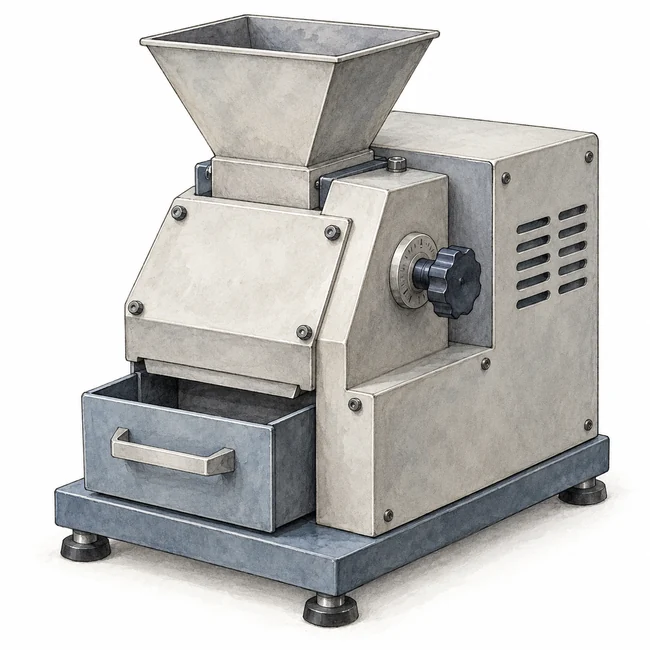
Crushing
Breaking larger pieces into smaller material as an initial sample-preparation step.
Generic laboratory jaw crusher · illustration
Practical training
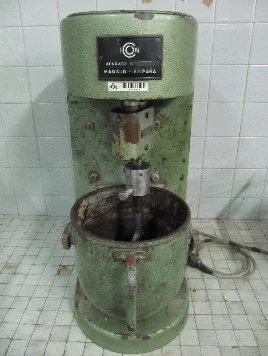
Mortar preparation
Preparing mortar specimens consistently for subsequent physical testing.
Laboratory mortar mixer · reference photograph
Practical training
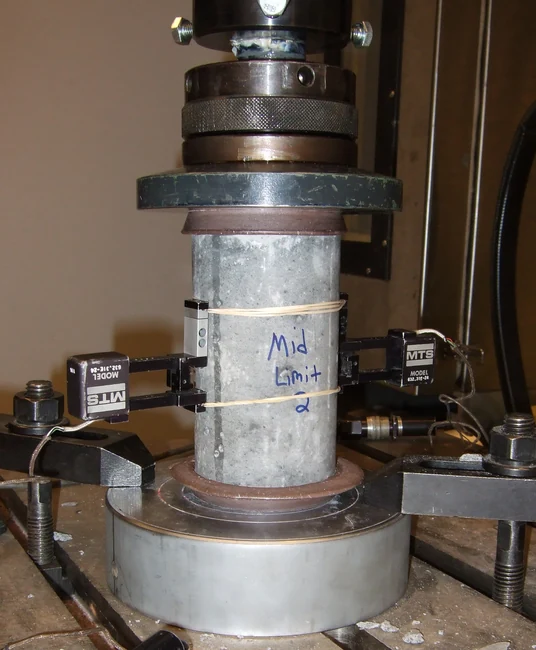
Compression tests
Evaluating specimen response and strength under compressive loading.
Concrete-cylinder test shown as a general compression reference
Practical training
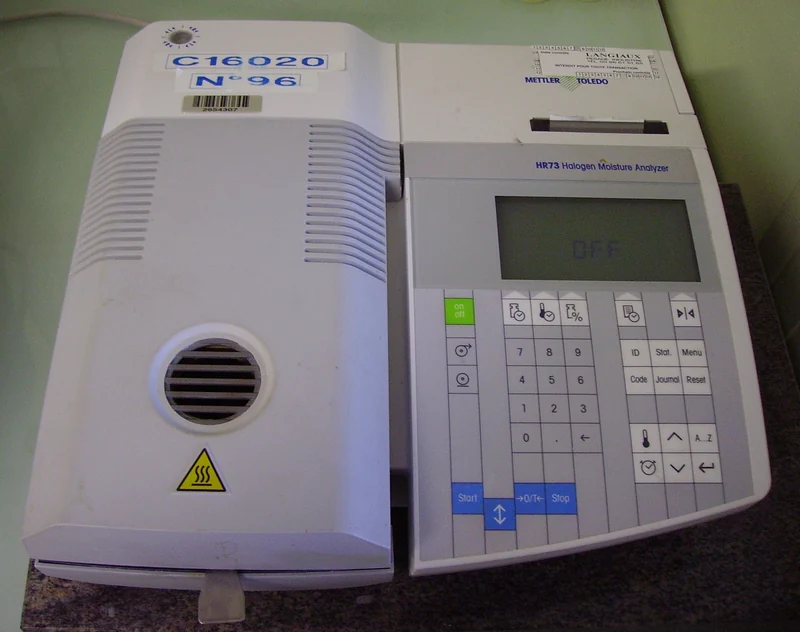
Moisture analysis
Determining the moisture content of a sample, an important part of material characterization.
Halogen moisture analyzer · reference photograph
Practical training
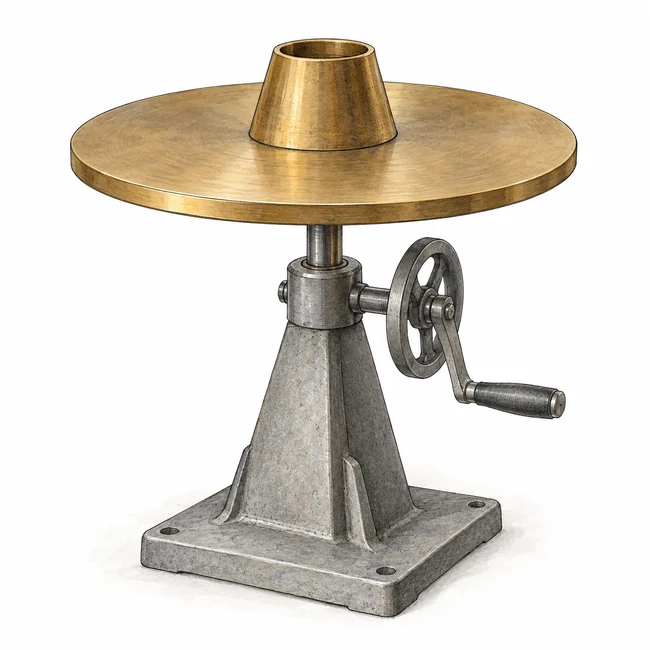
Flow tests
Assessing the consistency and spread of fresh mortar.
Generic mortar flow table · illustration
Images illustrate the techniques; they do not identify the exact instruments or facilities where I trained.
Equipment image credits and references
XRF:XRF equipment image · LinguisticDemographer · Public domain, released by author. Resized and converted to WebP; source license retained.
XRD:XRD equipment image · René Volfík / FZU Institute of Physics of the Czech Academy of Sciences · CC BY-SA 4.0. Resized and converted to WebP; source license retained.
Crushing: Original illustrative artwork. No company instrument or facility is depicted.
Mortar preparation:Mortar preparation equipment image · Carlos Castán-Fernández, Germán Marcos-Robredo, Miguel Ángel Rey-Ronco and Teresa Alonso-Sánchez · CC BY 4.0. Resized and converted to WebP; source license retained.
Compression tests:Compression tests equipment image · Xb-70; photo courtesy of Simpson Gumpertz & Heger, Inc. · Public domain, released by author. Resized and converted to WebP; source license retained.
Flow tests: Original illustrative artwork. No company instrument or facility is depicted.
A YEAR ABROAD
Working across disciplines and cultures.
From February 2025 to February 2026, Switzerland was the setting for my first full year of international industry experience. Laboratory practice, statistical analysis, software, and coordination were part of the same role.
It also meant working with local laboratories and plant managers, explaining technical findings to different audiences, and following the work beyond the initial report.
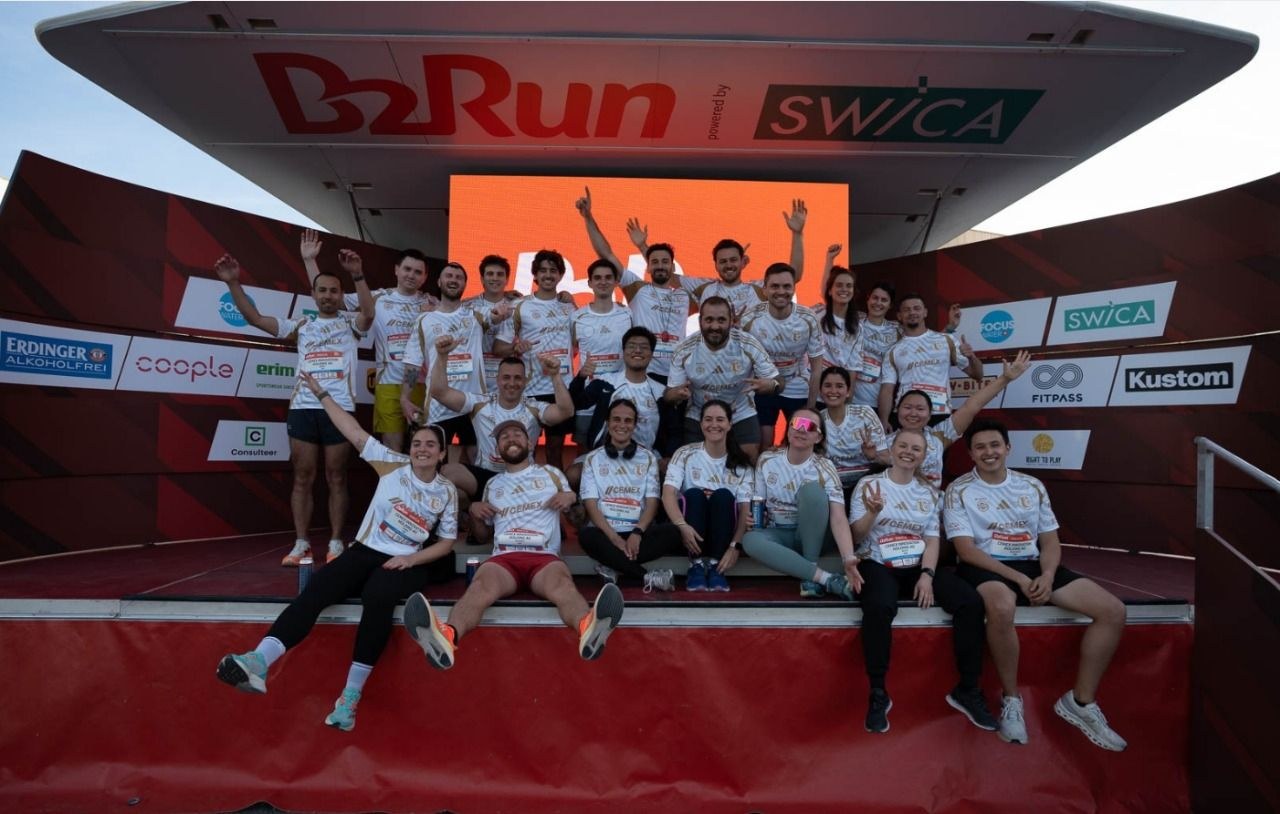
With the CEMEX team, outside the laboratory.
IN SWITZERLAND
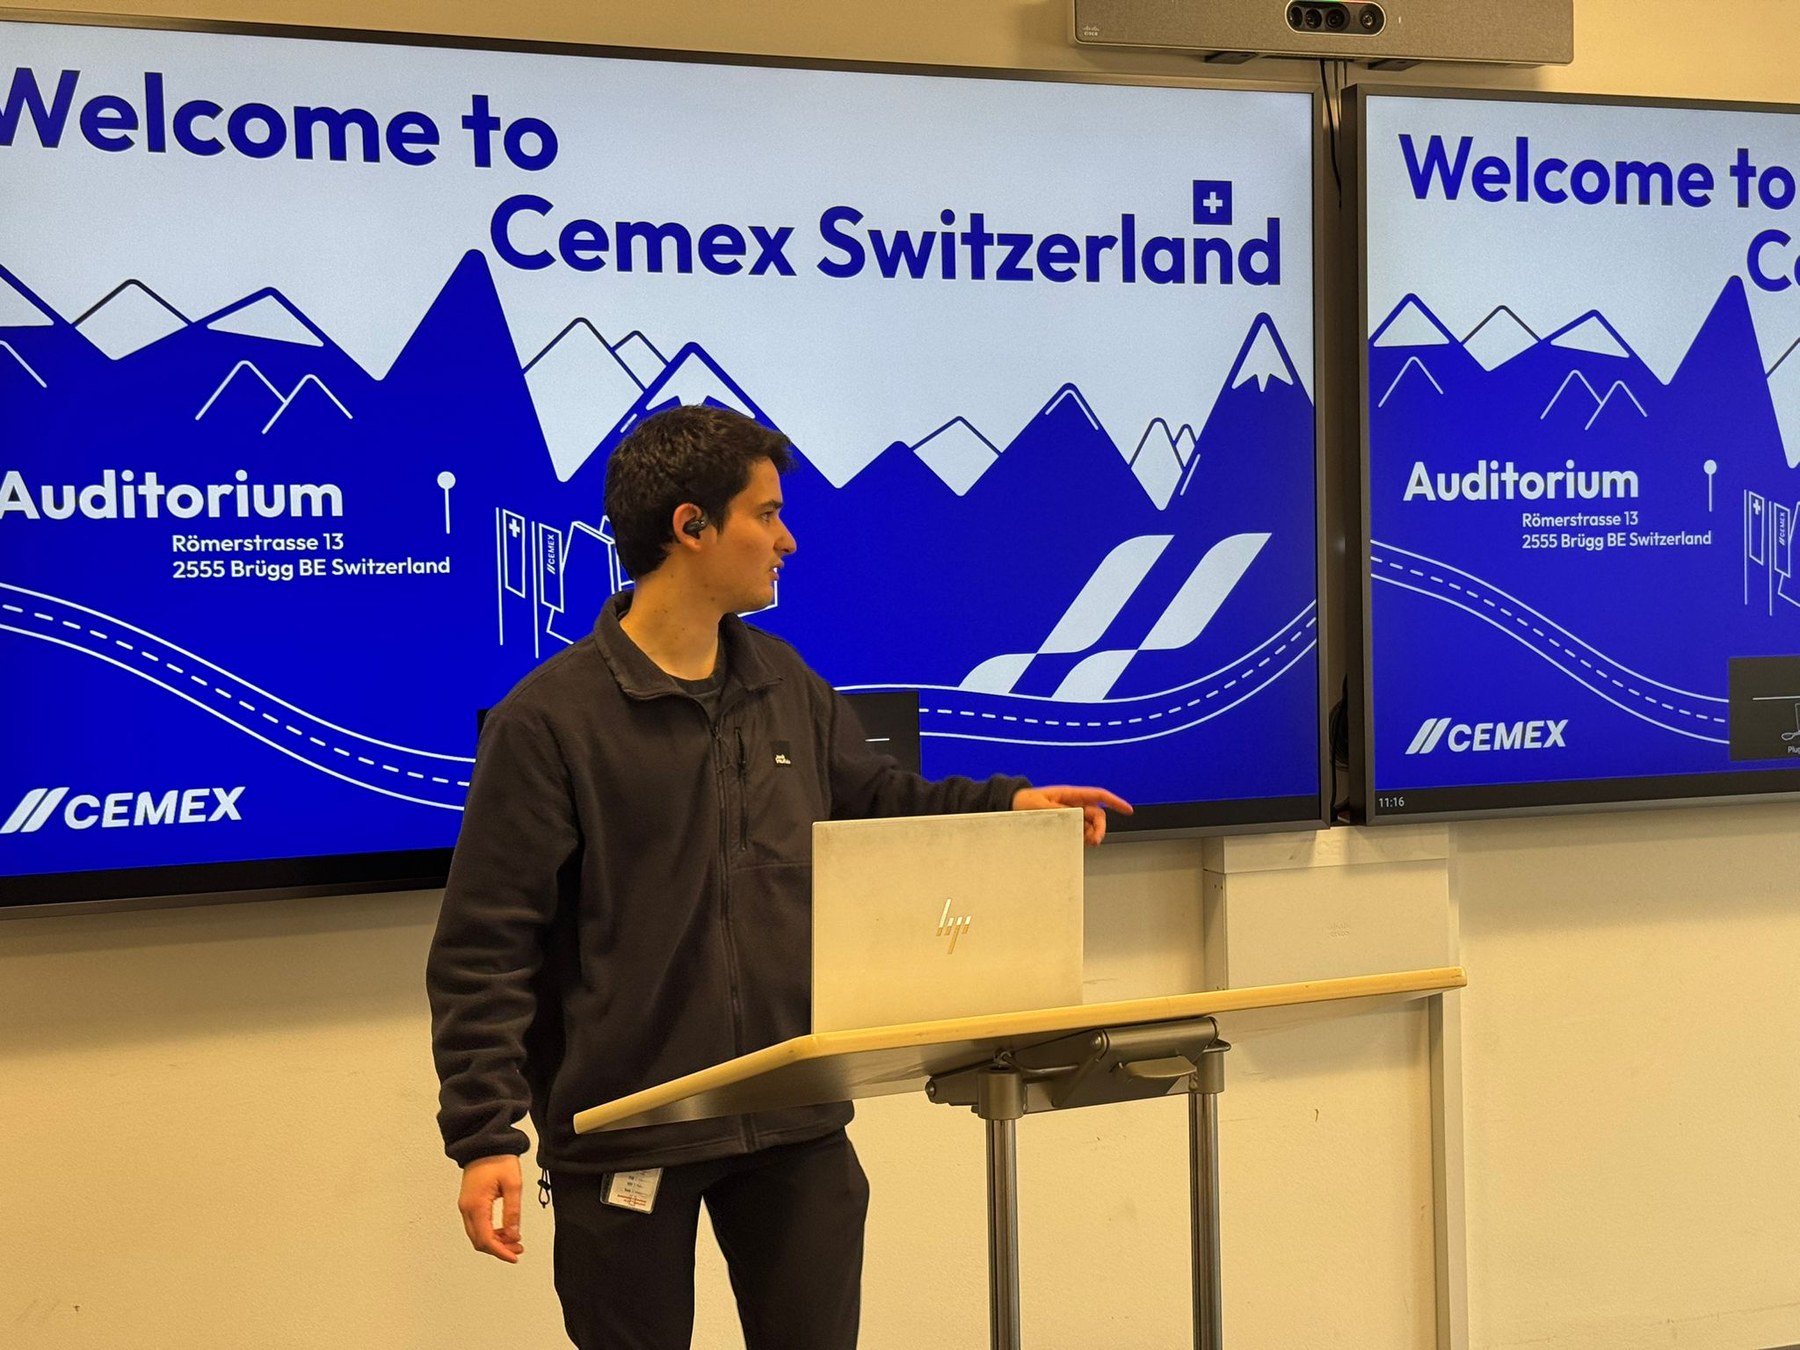
At CEMEX
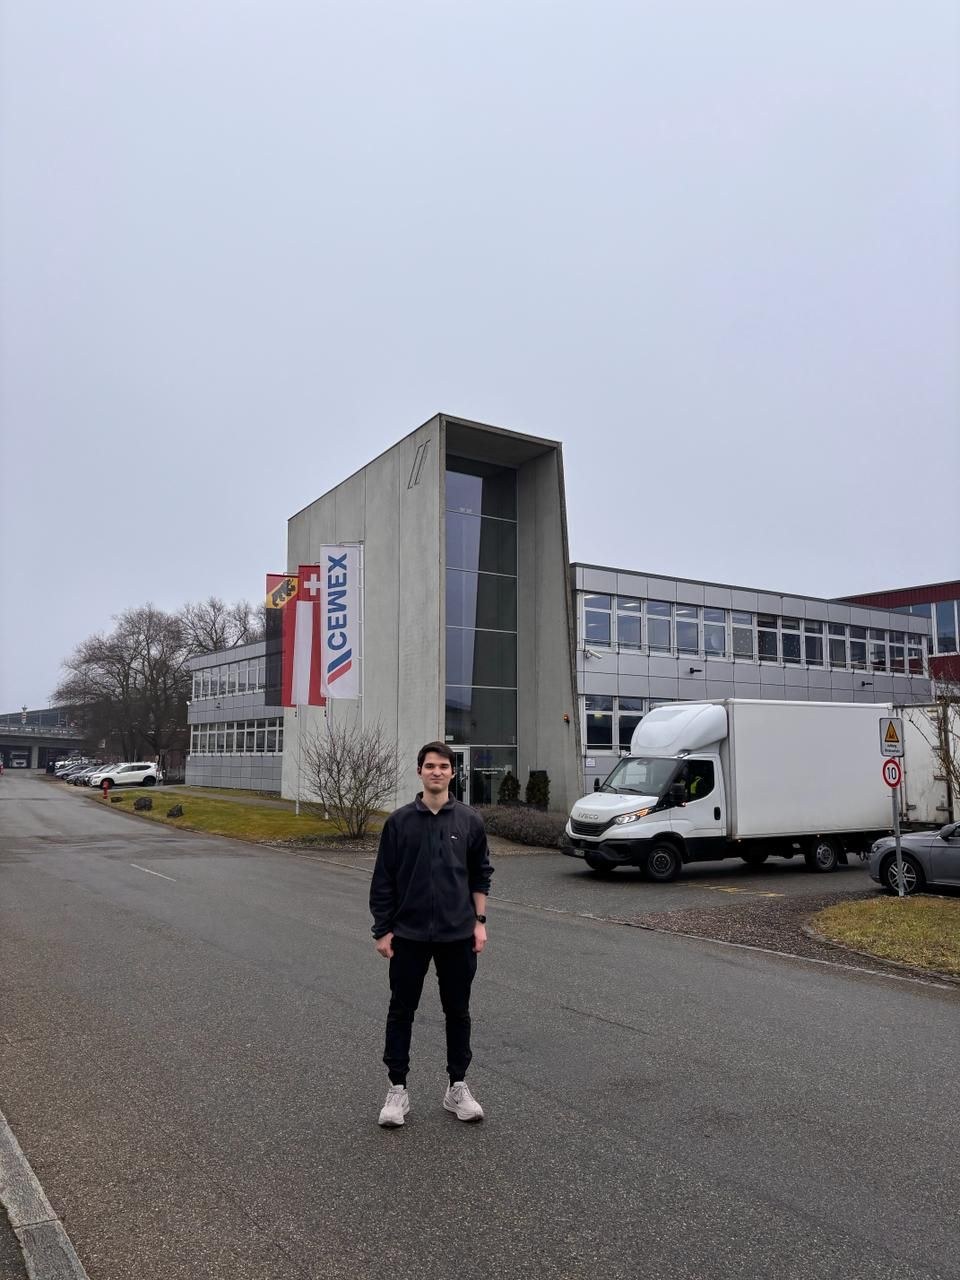
At the CEMEX Switzerland auditorium.Outside the CEMEX building in Switzerland.